|
Foundation piles, Rebar pipes, and other longer parts would be counted in Linear Feet, and the cost would vary due to length and labor involved, ranging from unit costs of $1 to $300. Items made from concrete were given the cubic yard measurement, and with the cost of concrete being the same, the cost of labor was the main thing that caused differences in price, with low unit cost being $600, and higher being $1,000. Due to the different shapes of steel we would be using, with both girders and reinforcements, the cost of steel was given in pounds, and cost did not vary, holding at around $3 per pound. The last remaining items were the deck of the bridge, with the black chip overlay being counted in Square Feet, and the considerations of the site including mobilization, field offices, etc. After consulting with Joe about these remaining items, each part was assigned a lump sum amount, based on both Joe’s previous experience and referencing past construction projects in New Jersey. After all the items were assigned both units and unit costs, and the final cost of material and labor came out to a little over $5.5 million, a 15% profit and overhead cost was applied, bringing the final cost of the project with regard to materials and labor to about $6.5 million. 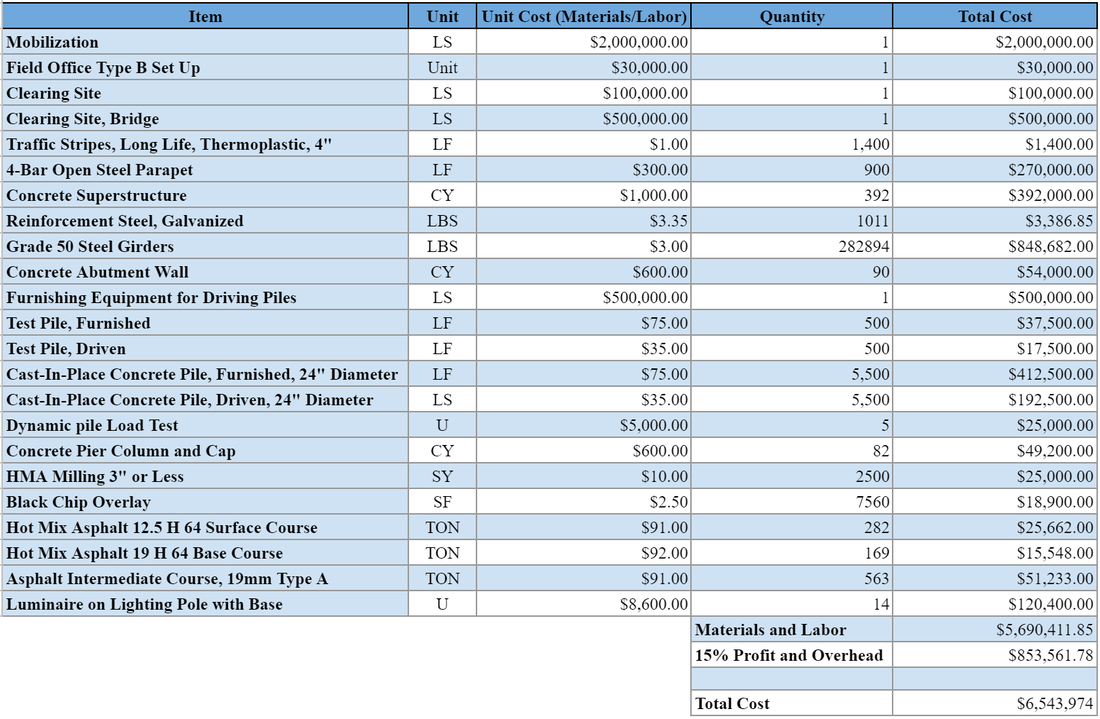
0 Comments
To finalize the connection between the structural and geotechnical aspects of the bridge replacement, a strut and tie truss was designed inside of the pier caps used to connect the girders to the foundations. Due to the large amount of girders and supports using the pier cap to transfer loads, Visual Analysis was used to analyze potential shapes of the strut and tie design, as well as the transferring of the load. In order to ensure adequate load transfer and structural integrity of the pier cap, the struts and ties were placed within the truss to try and make the most efficient transfer with regard to tension and compression paths. Once an acceptable truss layout was found, girder loads of 495 kips were applied to each top node, and the resulting forces each support pile needed to withstand were found, with the largest being 560 kips, and the lowest being 340 kips. 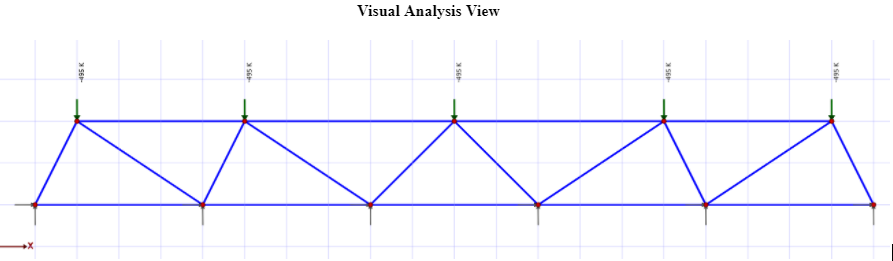 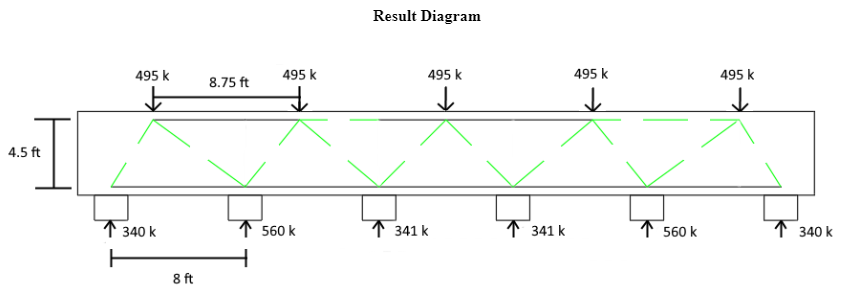 The soil improvement design focused on a column supported embankment design. The two displacement piles the team researched were VCC’s and CMC’s. VCC stands for vibro concrete columns and are constructed using a vibroflot connected to a concrete pump. CMC stands for controlled modulus columns and are installed by drilling with a reverse flight displacement auger. Because VCCs have a short embedding depth and would not be able to reach through the cohesive strata, CMC’s were selected. Load transfer platforms, or LTP’s were also designed and are used to distribute the load of the embankment evenly onto the columns below. The LTP design followed Collin’s Beam method, which allows for a larger column to column spacing, thicker LTP, but a low strength requirement for geosynthetic reinforcements. 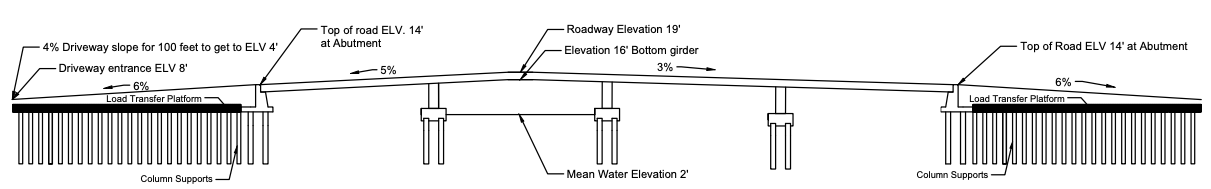 The girders were designed to support the traffic load, deck and their own self weight. They transfer these loads to the piers and abutments below. The height of the girder was limited due to the elevation and grading of the approaching roadway. Therefore girder spacing of 8.75 feet was used to allow for a shorter web depth. This permitted a 2.5 foot deck overhang, covering the 40 foot wide deck with 5 girders. After testing multiple designs with grade 50 steel, a web depth of 36 inches was selected with a 3 quarter inch thickness. The top and bottom flanges were given the same geometry to ease construction. The flanges have a 16 inch base with a 1 inch thickness. All geometries exceeded AASHTO recommended minimums as well as calculated minimums. After calculating a series of section properties and checks, the girder cross section and slab were used to calculate a design moment(5,622 k-ft) to compare with a factored load moment. The team also designed panels, shear connectors, and stiffeners, adding strength to the girders where necessary. The end panels are designed at 50 inch spacing and interior panels with 108inch spacing. The shear connectors are 6 inches with a ¾ inch diameter. The stiffeners are 6 inches wide and a half inch thick with a quarter inch fillet weld. 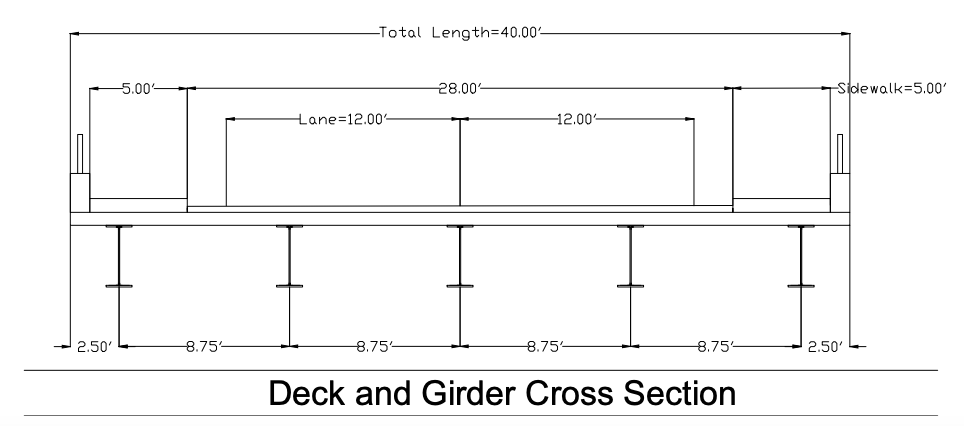 The geotechnical team began work on the pile design for the abutments and piers using the software program APile. The chosen pile design is a closed-ended concrete filled steel pipe pile. This design featured a 24” outer diameter and 23.5” inner diameter. The total length of the pile was 100’ and the total stickup length was 20’. The results outputted from APile were evaluated under two methods: The federal Highway Administration (FHWA) and the United States Army Corp of Engineers (USACE). Output variables used to calculate the total design load (Qd) included: skin friction (Qs), downdrag (Qdd), and end bearing (Qt). PDA construction method was assumed, allowing a factor of safety of 2.5.
The load path of a girder bridge starts at the deck. The load from a tire footprint travels through the depth of the deck where it is then distributed to the girders. Girders closest to the point of the load will support the majority of the force. Thus load is then transferred to the bearings and finally the foundations. The bridge will be designed using an HL- 93 model truck, shown below. In addition the self weight of the bridge will add to the axial load. This was calculated by using an estimated cross section of the bridge and multiplying it by the unit weight of the materials and the length of the bridge. The self weight came out to 742 kips and the addition of 6 HL-93 trucks brings the total axial load estimate up to 1174 kips. The foundations will also need to support lateral loads caused by winds and earth pressures/earthquakes. The wind load was calculated with the design wind load of .05 ksf acting on the super structure. The bridge is located in Seismic Zone I with an acceleration coefficient of 0.02. Therefore, a seismic analysis is not required and the total lateral load estimate came out to 28 kips per pier. The moment load came out to be 9433.3 K-Ft. This load was estimated by using the beam weight, deck weight and railing weight along with the overall length. With the axial load, lateral load, and moment calculated per pier from the structural team, the geotechnical team can begin working on the deep foundation design. 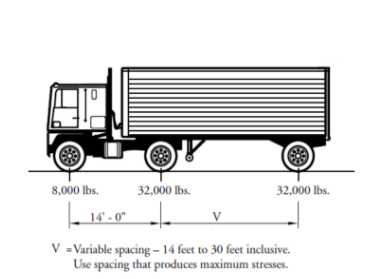 In order to determine the engineering design cost for the project, a scheduled timeline for the fall and spring semester phases was developed. The project was started off with background research, as well as a site visit. After the site visit of the bridge and the surrounding communities, realistic constraints were conceptualized. After this, soil profile and soil properties were determined, and site plans were drawn from the results. The list of each task and the progress of the tasks can be seen below. 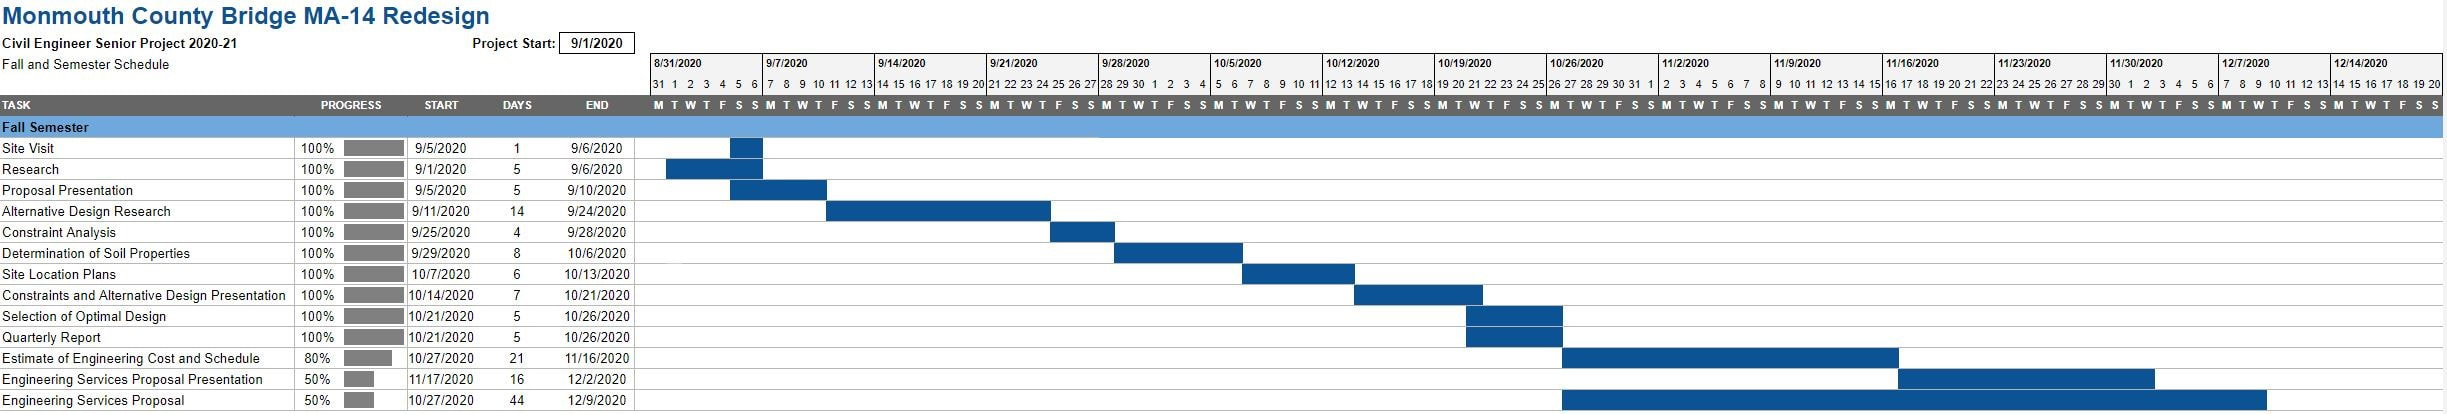 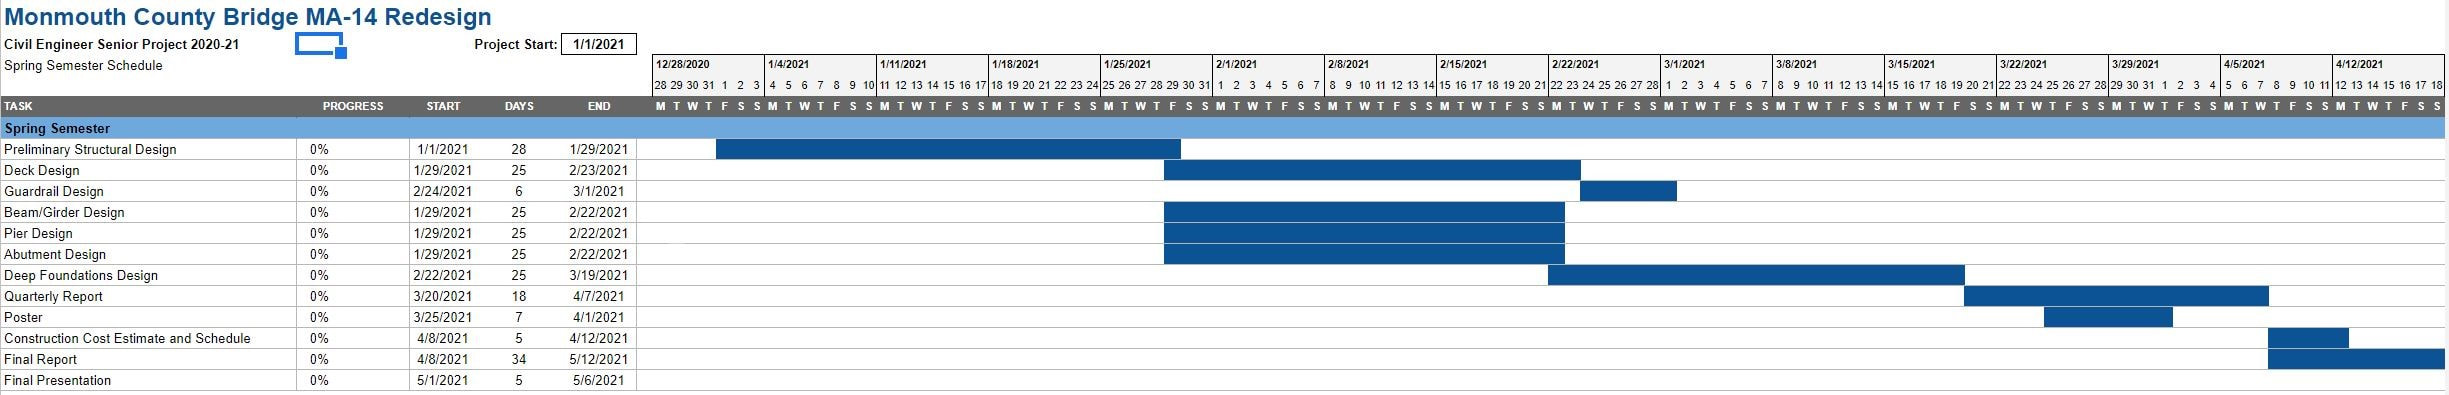 The team used a Design Selection Matrix composed of six categories to help select the ideal final design for the surrounding communities. The matrix uses criteria of differing importance to the project. Therefore, each category was given a percentage weight. This was done so the critical criteria would be accurately valued in the end calculation. The team gave the largest weight of 40% to the criteria of initial cost because the fundamental part of any project is the cost. This is the driving factor for all of the criteria in one way or another. The local economy and community were also a big factor, as the area is populated with marinas and businesses, so the already existing travel should not be interrupted. The specific percentage weight for each criteria are listed in the image below. The Girder Bridge had the highest score of 3.4 and was selected as the design. 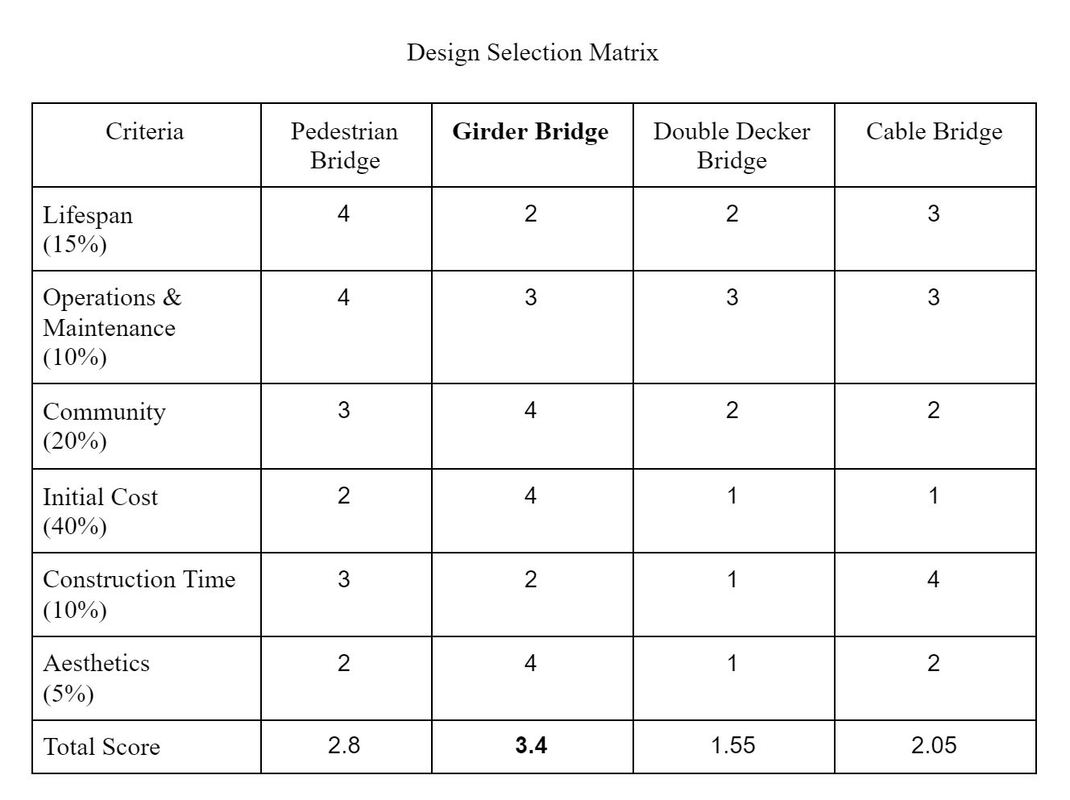 The boring logs were conducted by Oweis Engineering Inc. from the end of June to the beginning of August in 2011. A total of 15 borings were performed and 9 were chosen to be further analyzed. These 9 borings were chosen because each provided the most comprehensive sub surface profile. 6 stratas and 4 soil descriptions were determined by analyzing the boring Standard Penetration Test (SPT) and the soil description notes within the boring logs. This test was completed in accordance with the procedure outlined in ASTM-D1586. The groundwater table was assumed to be at an elevation of 6 feet. This was determined by using the tidal information for Matawan Creek. The groundwater table was set at the high tide line to give the most conservative scenario. Stratum C, organic clay, is the most critical stratum of our design and has an average thickness of 51 feet. This layer is located at the mudline of Matawan Creek and stretches across the entire project. It consists of dark gray organic clay and has an average SPT value of 0 blows per foot. 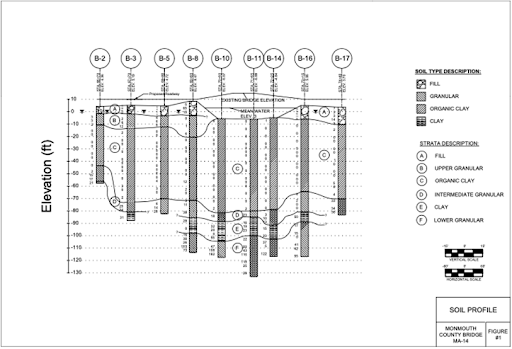 On Sunday, October 11, the team traveled to Keyport and Aberdeen township to visit the project site. We first went to the location of the bridge to observe the local marinas and boat traffic from Matawan Creek, as well as the car, cycling, and pedestrian traffic from the roadway. Our next locations of interests were parks and trails from both Cliffwood Beach and Keyport that were in close proximity to the bridge. Our final locations of our site visit were Keyport's Bayfront Promenade and downtown section. These final locations were visited in order to observe the surrounding communities, their relationship towards one another, and the importance of the bridge to their everyday life. More research and analysis is to follow. |